GEOPORTAL#
The CoGEOS dashboard is a dissemination tool for all the products developed under the project. It encompasses the Geomorphological datasets for the study area island countries, time series shoreline products, Mapographics, blog sections.
Functionalities#
Sign-up page#
Once you click on the platform link, it takes you to the Login in and Signup page. If you are using the platform for the first time, please hit the Signup option.
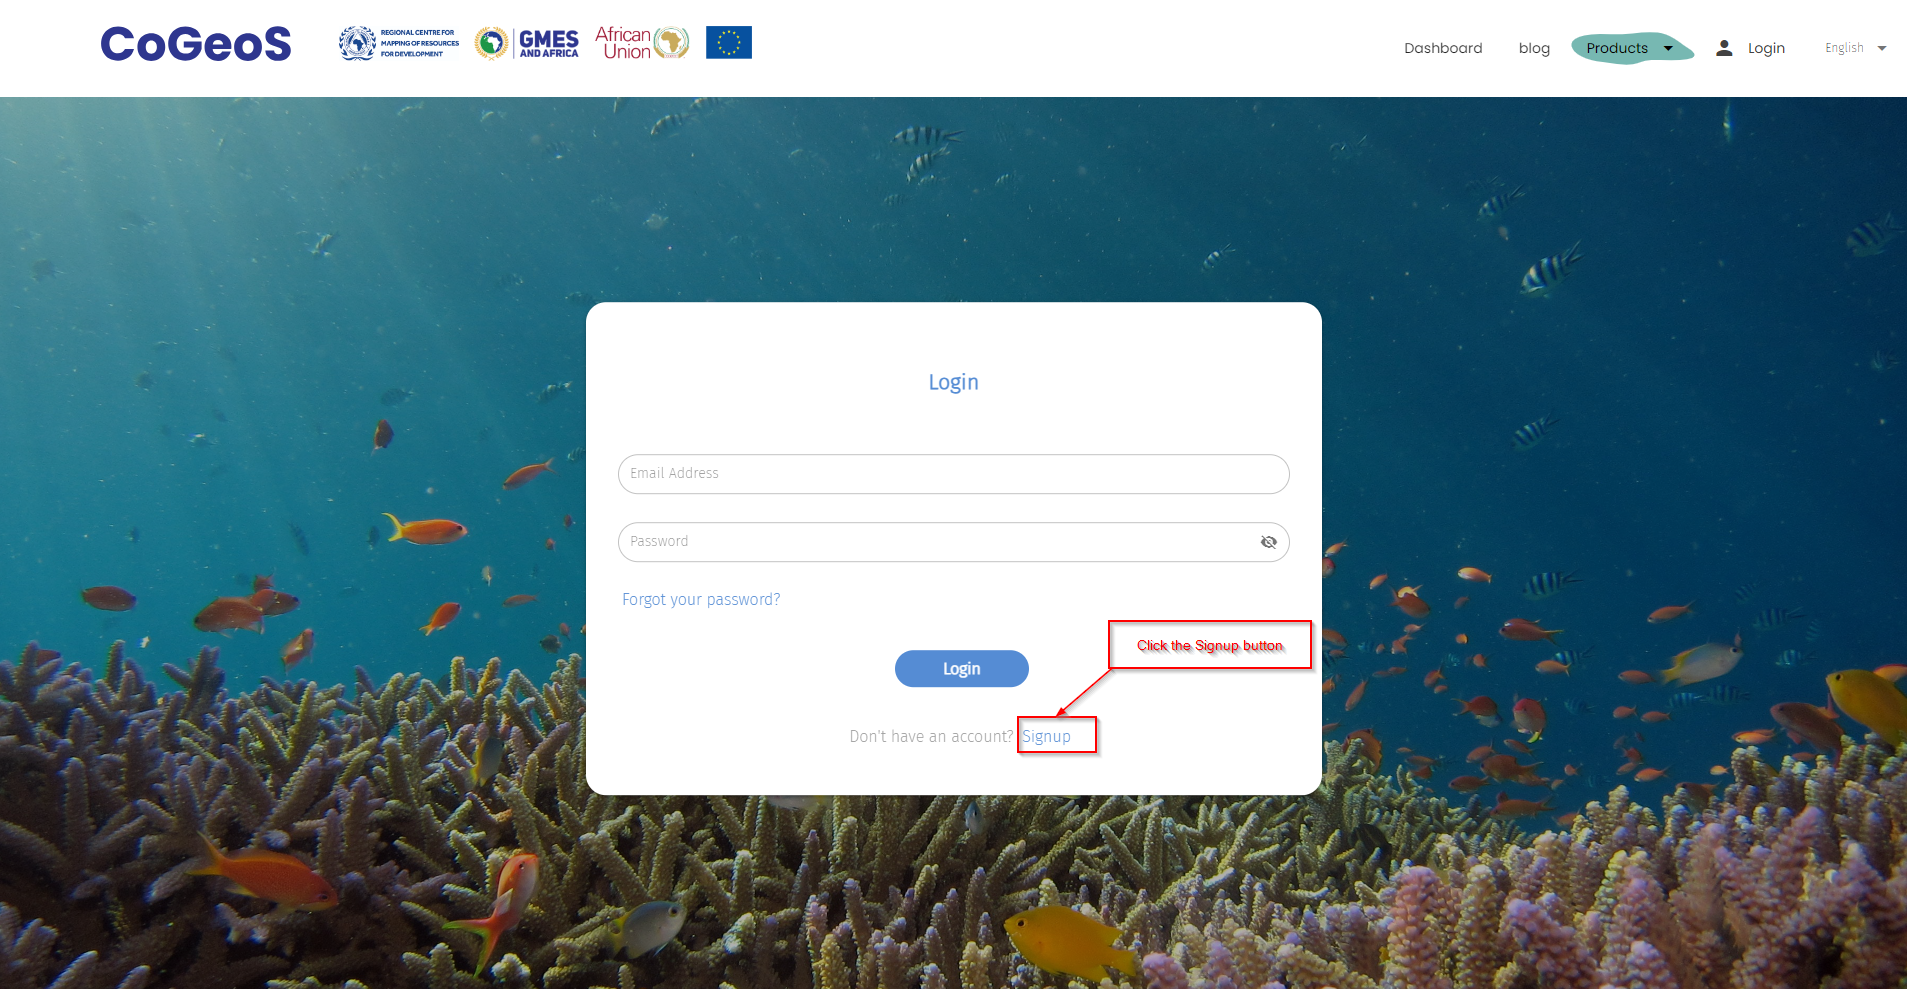
Figure 1:Login and Signup page#
Fill in your registration details as below.
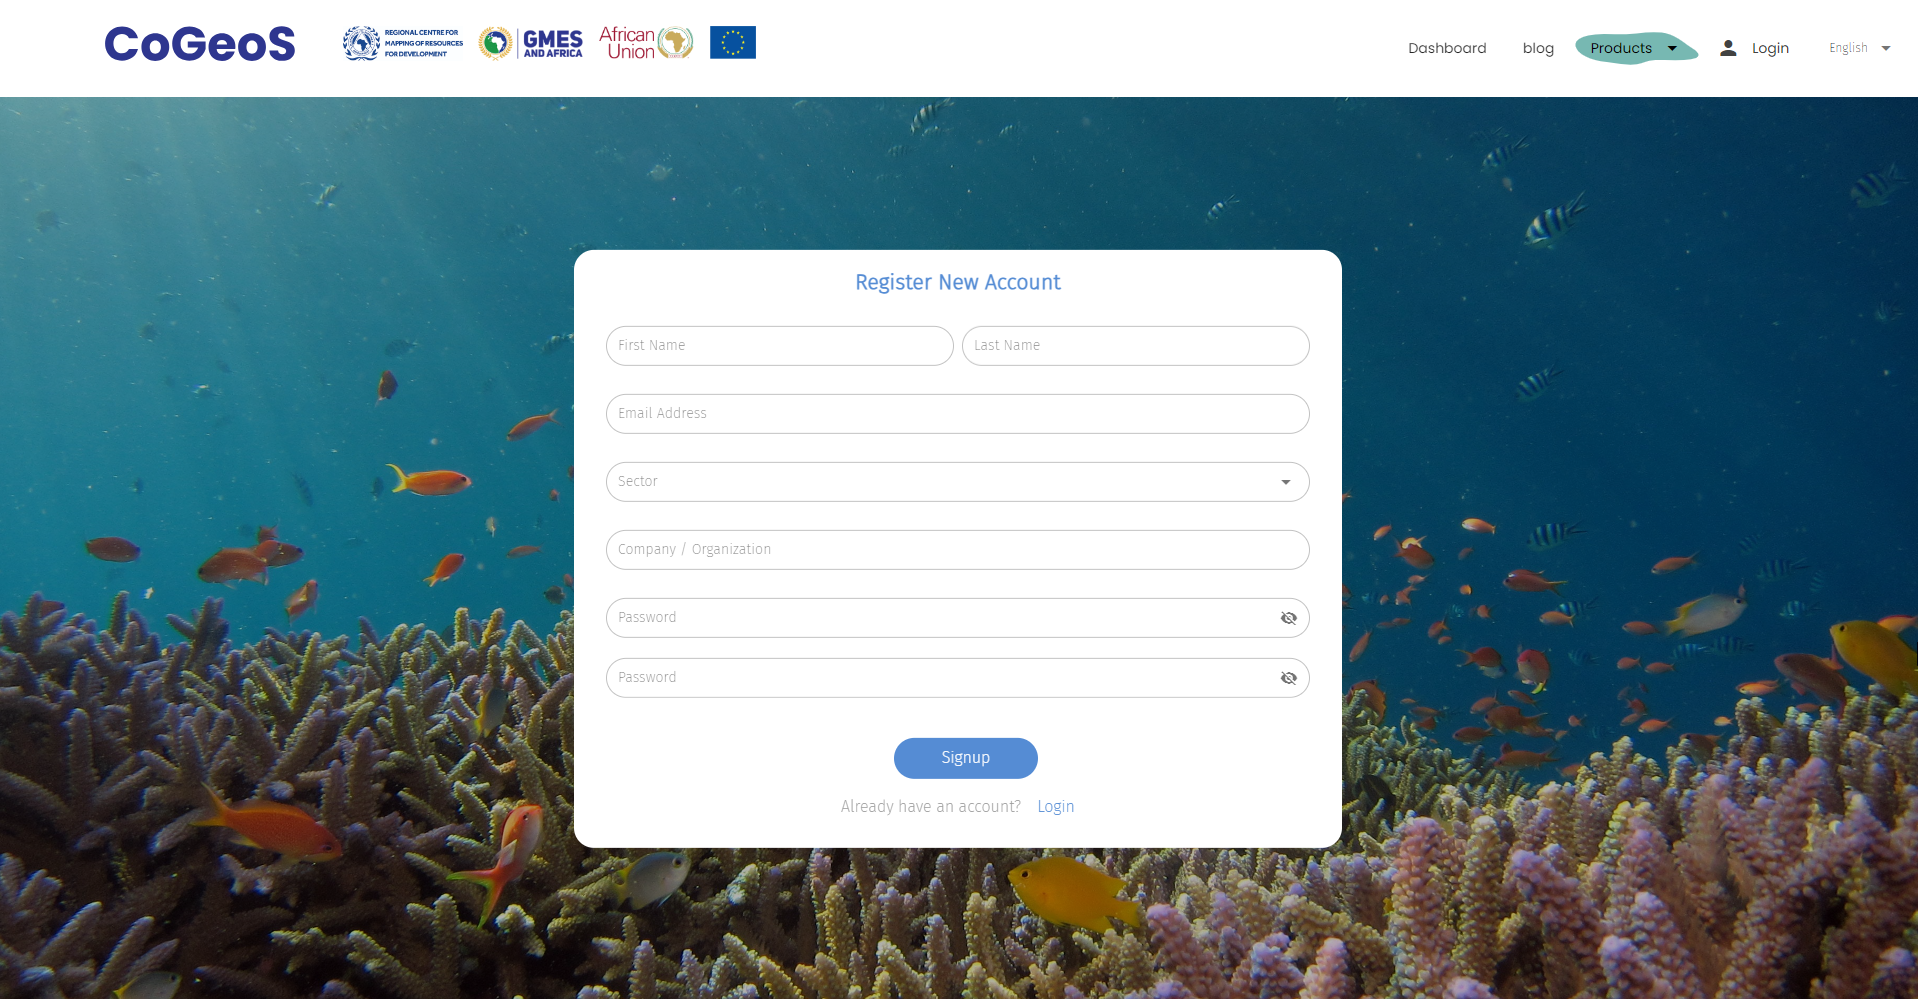
Figure 2: Registration details#
Open your registration email and confirm your registration
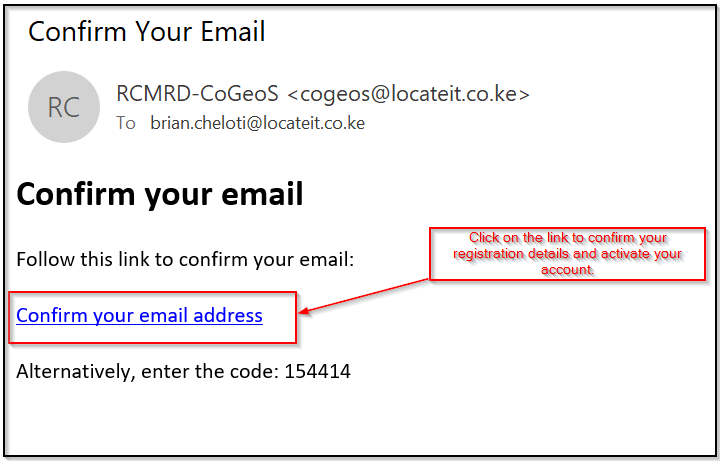
Figure 3: Registration details confirmation#
Now go back to the login page and login using your user email address and the password that you input.
On the homepage window, there are various buttons that routes you to different pages when clicked.
Language section whereby one click to change the language.
User profile whereby it highlights the first name of the user.
Products section which has the pdf link to the Mapographics and the plugin zipped file.
Dashboard which redirects to the interactive page for the visualized shoreline and geomorphological products.
Note
One can scroll down the homepage to access other ancillary information about the project.
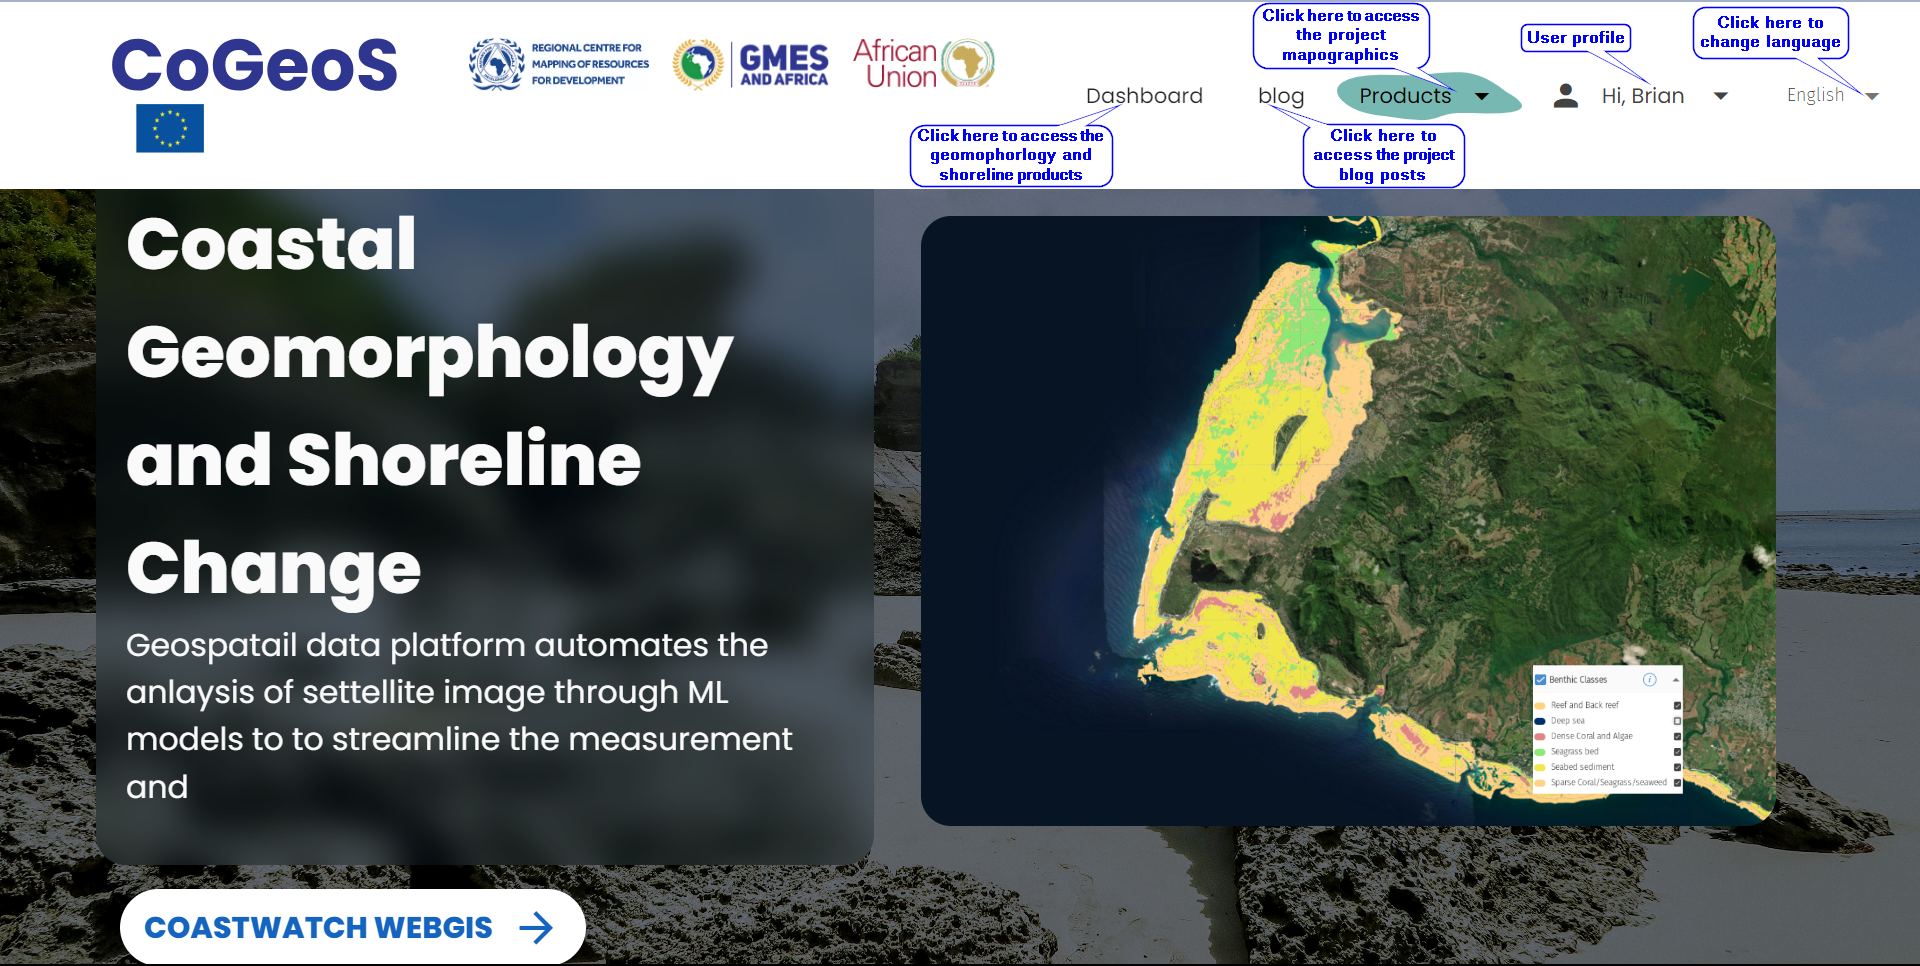
Figure 4: Home page#
Once on the dashboard, click on Mapped Areas tab to select the region of interest among the provided island countries which include: Seychelles, Mauritius, Madagascar and Comoros. The Marine protected Areas tab contains sections within the study areas whereby there are conservancies and protected lands. The Custom Areas tab gives the user an option to upload their own shapefile or draw a polygon of their area of interest within the selected mapped area. The layers panel encompasses the Benthic, Terrestrial and shoreline products in the descending order. Each layer has its respective pie chart and bar chart with the option to download the chart.
Note
Scroll down the layers panel to access other layers on the dashboard.
The map panel has map layers for both geomorphology and shoreline products. Each of the layers have an interactive legend where the user can check or uncheck a specific class of the geomorphological/shoreline layer. A user can also click on the rendered color of any class to change the color rendering to a different color of choice. The legend also has an info icon that contains information about the layer being visualized together with its corresponding classes. Below the legend are basemap layers where the user can click to change the background of the map panel. The map panel also has layer controls that are used to zoom in, refresh and zoom out contents on the map.

Figure 5: Layers panel#