The CoGEOS Shoreline Extraction plugin works with external python libraries when handling most of its analysis.
Therefore, before the plugn is installed, you would have to install all external libraries with the following procedure.
Open the QGIS python console.
Click on show editor .
Paste the following code into the untitled file.
Click run.
importsubprocesspackages=['earthengine-api','folium','rasterio','rtree','pandas','geopandas','pyCRS','geemap','mapclassify','contextily','matplotlib_scalebar','opencv-python','natsort','scikit-learn']try:forpackageinpackages:subprocess.run(["pip","install",package])print(f"{package} installed successfully")exceptsubprocess.CalledProcessErrorase:print(f"Error installing the dependencies: {e}")
The development of this plugin has been specifically designed to extract shorelines utilizing a flexible approach, making use of both radar and optical imagery sources. The selection of which type of imagery to use is contingent upon the particular focus and requirements of the user.
Multiband Sentinel 2 Images at a resolution of 10m are downloaded with the help of the earthengine-api. The result is an image with 4 bands, that is, Red,Green, Blue and NIR. For shoreline extraction, the NIR band is of importance. The Red, Green and Blue band can be used to create a basemap for confirmation.
Shoreline extraction with optical imagery uses the Near Infrared band to delineate land and water masses. It takes a singleband or multiband raster image from which the
Near Infrared band can be selected for use in the analysis. The output is a GeoJSON file with a polygon showing the land mass including the shoreline. From this, the shoreline can be extracted.
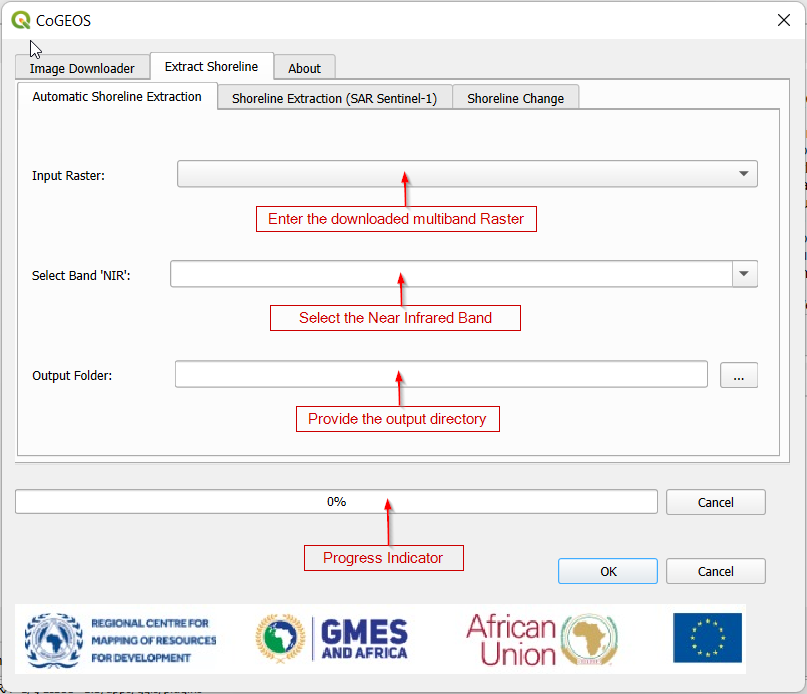
Figure 2: Shoreline Extraction with Optical Imagery#
Automatic Shoreline Extraction with optical imagery takes 3 parameters. That is:
Multiband Raster - This is the image that was initially downloaded from the image downloader. For purposes of consistency, please use the downloaded image.
NIR Band - The plugin counts the number of bands in the multiband raster image. You will be required to select the band number that represents the NIR band.
Output Foder - This is the directory where you want to save the extracted shoreline.
This method of shoreline extraction uses Synthetic Aperture Radar imagery from Sentinel 1 to delineate water masses. The result is a GeoJSON file showing the edges from which shorelines can be estimated.
This tehnique uses the earthengine-api meaning the image doesn’t necessarily have to be within your local directory. You only have to provide a gridded shapefile showing your Area of Interest (AOI).
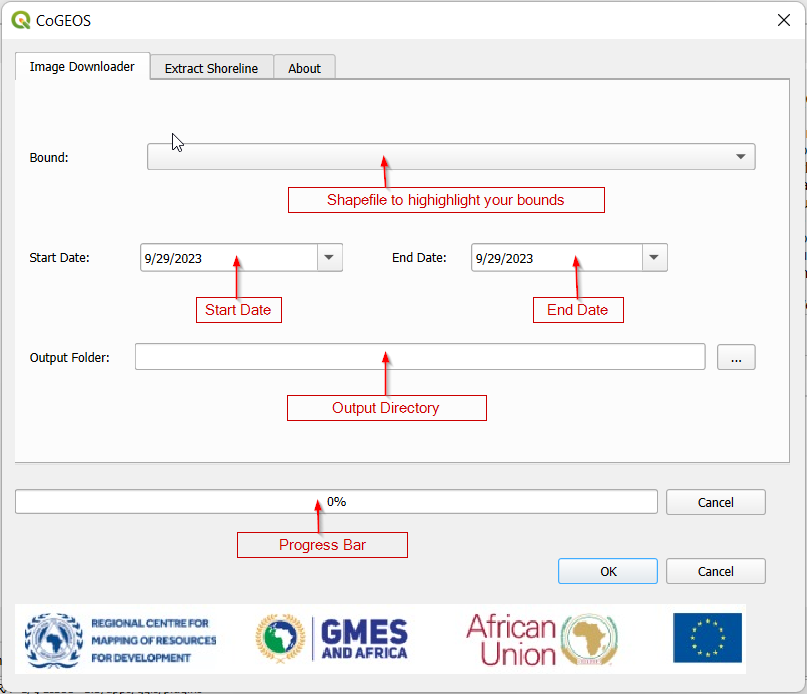
Figure 3: Shoreline Extraction with Optical Imagery#
This method of shoreline extraction takes 4 parameters. That is:
Bound - This is a gridded shapefile showing your area of interest.
Start Date - This is the beginning of your analysis period.
End Date - This is the end if your analysis period.
Output Directory - This is the folder that will hold the output results of your work.
Note!
The bound in should be gridded to reduce download and processing time.
Once a user has obtained the shorelines, changes can be computed regardless of the technique chosen.
This section takes a baseline and comparison shoreline together with their respective years from which the rates of change can be computed.
Baseline Shoreline - This is the shoreline at the beginning of you analysis period.
Baseline Year - This is the year during which the baseline shoreline was generated.
Comparison Shoreline- This is the shoreline to be used for comparison.
Comparison year - This is the year during which the comparison shoreline was generated.
Output Directory- This is the folder within which the shoreline change outputs will be stored.
Shoreline change produces 4 files:
Retreat - This is poygon data showing the areas where the shoreline retreated.
Retreat Points - This is point data highlighting the specific points where the shoreline retreated. It also contains attribute data change_m showing the amount of retreat.
Growth - This is polygon data showing the areas where the shoreline grew.
Growth Points - This is point data highlighting the specific points where the shoreline grew.It also contains attribute data change_m showing the amount of growth.
Shoreline Change - This is a combination of retreat_points and growth_points. This quantifies the totalshorelinechange and changeratesperyear. Negative changes indicate retreat while positie changes indicate growth.
 .
.